What gold-on-carbon is
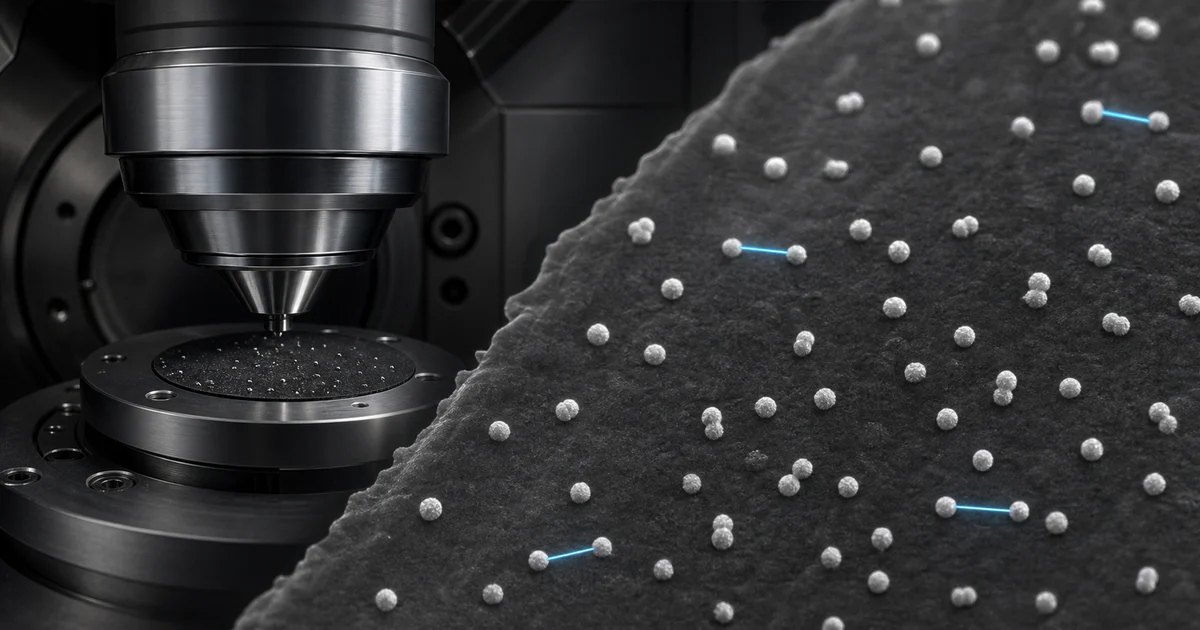
A gold-on-carbon (GOC) resolution test sample is exactly what it sounds like: a substrate of amorphous carbon coated with a thin layer of gold particles. The carbon provides a low-Z (low atomic number) background; the gold particles provide high-Z (high atomic number) features that stand out brightly in secondary-electron and backscattered-electron images.
The particles are typically 3-10 nm in size, deposited at low coverage so that some particles are isolated and others are close together. The gaps between adjacent particles span a continuous range from large (easily resolved) to small (challenging or impossible to resolve).
To test SEM resolution: image the sample at high magnification, optimize the imaging conditions, and find the smallest gap between two adjacent particles that you can still clearly distinguish as two separate features. That separation is the practical resolution of your instrument under those conditions.
Why GOC dominates as the resolution standard
Several reasons:
1. High contrast. Gold (Z=79) produces strong electron signal compared to amorphous carbon (Z=6). This gives sharp, high-contrast images of the particles against the background.
2. Well-defined particles. Small gold particles are roughly spherical with distinct edges — easy to identify and measure.
3. Natural separation range. Random deposition produces gaps ranging from large to very small, covering the resolution range of typical SEMs.
4. Chemical stability. Gold is a noble metal that doesn't form a stable oxide under normal conditions and is unchanged by typical SEM operating conditions. (Some contamination via redeposition or hydrocarbon film accumulation can still occur, like for any sample in an imperfect vacuum.)
5. Historical convention. GOC has been widely used for decades and remains a common reference for SEM resolution testing. Modern instruments and manufacturers also use other standards (nanofabricated pitch patterns, silicon lattice samples in some contexts, custom test specimens), but GOC results are comparable across instruments and over time, which keeps it in routine use.
6. Reasonable cost. Commercial standards are affordable (typically $100-500 per sample) and last many imaging sessions.
Alternatives like tin balls on carbon, magnetic particles, or specially-fabricated periodic structures exist for specific use cases, but GOC remains the dominant choice for routine resolution verification.
What the test actually measures
"Resolution" can mean several things; GOC specifically measures point-to-point resolution — the minimum separation between two distinct features that can be unambiguously distinguished as separate.
This is different from:
- Minimum feature size: the smallest single bright object detectable. Usually smaller than point-to-point.
- Edge resolution: how sharply an edge can be defined. Depends on signal-to-noise and edge contrast.
- Information limit: the smallest spatial frequency present in the image (relevant for TEM, less so for SEM).
For SEM, point-to-point resolution is the most commonly cited specification, with GOC remaining a widely used reference sample for verification. Specific manufacturer test conditions may use other specimens or proprietary test patterns.
Operating conditions for resolution measurement
Resolution depends strongly on operating parameters:
Accelerating voltage: higher voltage = shorter de Broglie wavelength = smaller diffraction limit. But also more beam penetration into the sample (information from deeper, blurring surface detail) and more sample damage. Field-emission SEMs are often best at 1-5 kV for surface-sensitive resolution; conventional tungsten SEMs often need 20-30 kV.
Working distance: shorter WD = stronger lens current = better resolution, generally. FEG-SEM typically operates at 3-5 mm for highest resolution.
Aperture: smaller aperture = better resolution (less spherical aberration) but lower beam current (worse signal-to-noise). Need to balance.
Beam current: more current = more signal = better SNR. But also more sample charging, contamination buildup, and beam damage.
Astigmatism correction: critical. Residual astigmatism smears the beam shape in one direction, degrading resolution. Always re-correct stigmation at high magnification.
Scan speed and averaging: slower scan = more dwell time per pixel = better SNR. Averaging multiple fast scans reduces drift impact.
Detector choice: in-lens (immersion) detectors give better surface-sensitive resolution; in-chamber detectors collect more total signal but with slightly lower resolution.
Manufacturer specifications quote the BEST achievable resolution at OPTIMAL conditions. Typical research-grade FEG-SEM specs:
- 0.7-1.0 nm at 15-30 kV.
- 1.2-2.0 nm at 1-5 kV.
Real-world routine performance is often somewhat worse — within ~1.5x of spec is normal for well-maintained instruments; >2x of spec suggests a problem.
The measurement procedure
A standard GOC resolution test:
Mount fresh GOC sample: load onto SEM stub. Avoid contamination during mounting.
Stabilize: allow 10-30 min for thermal equilibration after closing chamber.
Approach conditions: set initial conditions for best expected resolution (e.g., 15 kV, 5 mm WD, smallest aperture for the resolution range).
Coarse focus: find a clearly imageable region of particles at moderate magnification (say 50,000x).
Stigmate: with a clearly-imaged group of particles in view, alternate fine focus and stigmator adjustments until the particles are crisp.
Zoom in: switch to high magnification (100,000-500,000x depending on instrument).
Re-stigmate at high magnification: critical. Stigmator settings often need re-tuning at very high magnification.
Identify candidate pairs: find two adjacent gold particles separated by a small but visible gap.
Measure: use software measurement tool to measure the gap between the two particles (peak-to-peak or edge-to-edge depending on the convention).
Find the smallest distinguishable separation: the gap is "resolved" if you can clearly see two separate intensity peaks across it (use line profiles to check).
Repeat with multiple pairs: take the minimum measurable separation as the resolution estimate; report any uncertainty.
Document: standard ID, operator, date, all conditions, line profile data, resolution result.
Different operators may find slightly different results — judgment is involved in deciding "are these two particles or one." For QA-grade work, multiple operators may verify the same sample, or quantitative criteria (e.g., minimum contrast valley between peaks) may be used.
Line profile analysis
For quantitative resolution measurement, draw an intensity line profile across two adjacent particles. The criterion: the profile shows two distinct peaks separated by a valley.
The Rayleigh criterion (from optical microscopy): two point sources are considered "just resolved" when the maximum of one diffraction pattern (Airy disk) coincides with the first minimum of the other. For incoherent Airy patterns this produces a valley at about 81% of peak intensity — a ~19% intensity dip between the peaks.
For SEM, simpler criteria are common:
- 50% criterion: two peaks are "resolved" if the valley between them drops to 50% or less of the peak height.
- 80% criterion: stricter; valley drops to 80% of peak height.
Different criteria give somewhat different resolution numbers for the same image. ISO standards specify the exact criterion to use for traceable testing.
Common pitfalls
Astigmatism: residual astigmatism makes the beam elliptical. Particles appear elongated in one direction. Always re-correct stigmation at the measurement magnification.
Drift: thermal drift, charging-related drift, mechanical instability all blur images during slow acquisition. Use fast scans or averaging; ensure adequate stabilization time.
Contamination: hydrocarbon contamination from the chamber deposits on the imaged area during long imaging. The resulting carbon film blurs detail. Use new sample regions; minimize dwell time.
Sample charging: even on GOC, if the carbon substrate isn't well-grounded, charging shifts and blurs the image. Use conductive mounting and check ground connection.
Detector saturation: at very high beam current, the detector electronics can saturate, compressing the bright peaks and degrading apparent resolution.
Wrong magnification: if magnification calibration is off, the measured resolution is also off by the same factor. Calibrate magnification first.
Reporting
A formal resolution measurement report should include:
- Instrument identification (serial number, configuration).
- Date and operator.
- All operating conditions (kV, WD, aperture, beam current, detector).
- Sample identification (GOC standard, lot, certificate if applicable).
- Acquisition parameters (scan speed, averaging).
- Method (which resolution criterion was applied).
- Multiple measurements with statistics.
- Image(s) of the actual measurement, with overlays showing the measured features.
- Comparison to manufacturer specification.
- Conclusion (pass/fail vs criteria).
For ISO 17025 calibration records, all of this is archived for traceability and audit.
A note on TEM resolution standards
Resolution standards differ for TEM:
- Crystalline samples with known lattice spacings (silicon, gold, graphite) provide periodic features at sub-nm scale.
- Young's fringes: imaging an out-of-focus pattern and analyzing for the smallest fringes.
- Information limit (Thon rings): analyzes the diffractogram of an amorphous sample image.
GOC is mostly for SEM. For TEM resolution, atomic-lattice samples are the standard.
Linking to the physics
Resolution is fundamentally limited by diffraction at the lens aperture (Abbe limit) plus aberrations of the optical system. For accessible plain-English coverage of these concepts in the context of any microscope:
- How microscopes work — covers diffraction limit, NA, and the visible-to-electron transition.
- How lenses actually work — lens basics and aberration types.
For SEM operationally, see also semsip's existing articles on astigmatism correction and focus/stigmation workflow.
The takeaway
Gold-on-carbon (GOC) is the standard resolution test sample for SEM. It consists of small gold particles (3-10 nm) on an amorphous carbon substrate, providing high-contrast features at point-to-point separations near the instrument's resolution limit. Modern FEG-SEMs achieve 0.7-2 nm under optimal conditions; conventional tungsten SEMs typically 3-5 nm. Resolution depends on accelerating voltage, working distance, aperture, beam current, astigmatism correction, drift, and contamination. Manufacturer specifications are usually best-case; routine performance is typically somewhat worse. Standard procedure measures point-to-point separation between adjacent particles; line-profile analysis with explicit valley-depth criteria provides quantitative results. For traceable QA work, ISO and similar standards specify measurement procedures and acceptance criteria.